UAV surveying and mapping
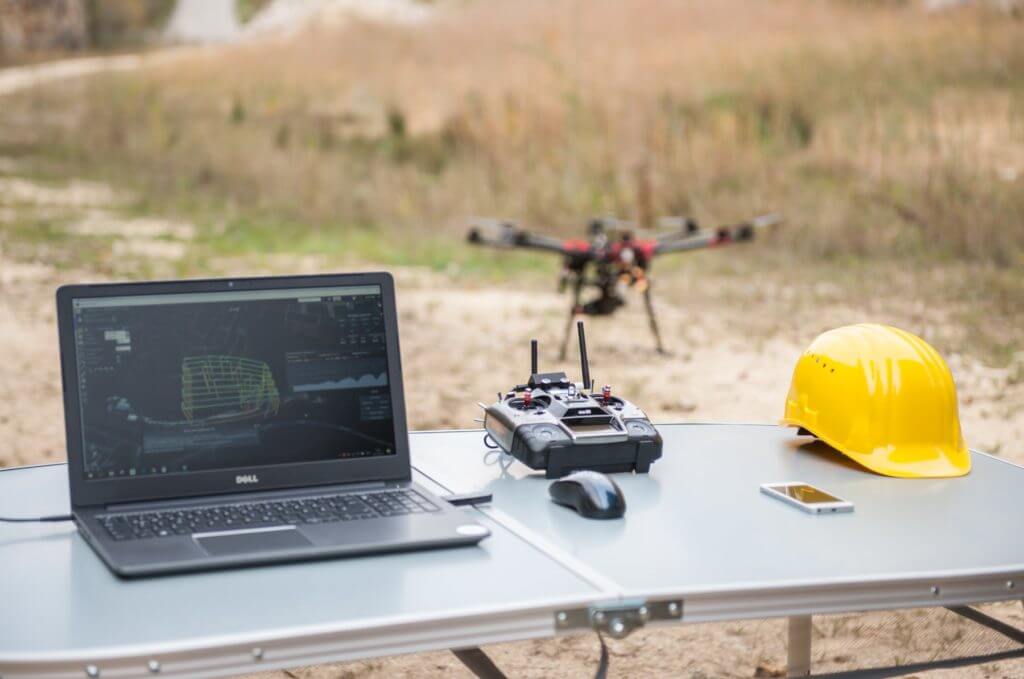
With our UAVs, we are able to three-dimensionally survey large and/or difficult-to-access areas in an efficient, contact-free and high-precision manner. From the photos or laser scanning data taken during flights (photogrammetry), we process a 3D point cloud, on the basis of which we derive high-precision data records, such as georeferenced orthomosaic photos and digital terrain models (DSMs / DTMs / height grids). By means of GIS, CAD or BIM software, colourful topographic maps, site plans and as-built plans can efficiently be created out of this material.
UAV surveying: Recording of geodata using UAV photogrammetry or UAV laser scanning
Photogrammetry is an established method for obtaining three-dimensional information for surveying based on photographs taken from the air. We create a textured (colour) 3D point cloud from these images for the purposes of surveying and evaluation. Scanning points taken by a UAV LiDAR deliver a very similar result, because these, too, provide a dense and mostly colourless point cloud after processing, which permits measurements, evaluations, documentation, realistic representations and panoramas.
We supply the following UAV surveying results based on point clouds in a predefined output format:
- Point clouds as a result of 3D UAV surveying / 3D documentation
- Orthomosaic photos from different recording angles; e.g. of façades, towers or bridges (recording from bottom to top)
- Georeferenced orthomosaic photos of the earth surface in a wide variety of scales and resolutions
- Digital terrain models, including digital elevation models (DEM), digital terrain models (DTM) and digital surface models (DSM)
- 3D models and 2D drawings
- Volume calculation and quantity surveying
- Regular documentation of volume and quantity movements, development and subsidence
- Difference comparison of quantity changes (delta calculation)
- Data logging for inventories and accounting for stock levels (value determination)
- Target/actual comparisons for checking and/or determining consumption
- Determining and updating forecasted billing quantities
- Calculating filling volumes
- Calculating removed and added volumes and volume orders
- Monitoring slope movements
- Cubature calculations
- Project progress measurements
Point clouds
The point cloud allows for the depiction of complex surface structures and objects using a large number of single points in a three-dimensional coordinate system, which is usually defined by X, Y and Z coordinates. The point cloud is the first UAV surveying result. The scanned points taken from our UAVs using photogrammetry or a UAV LiDAR scanner result in a dense point cloud after processing. Additional results, such as orthomosaic photos, 2D map material and 3D terrain models with respect to surveying, can be deduced from the point cloud.
Orthomosaic photos
Orthomosaic photos, or orthophotos for short, refer to distortion-free images of the earth’s surface or surfaces such as façades or bridges. The images are aligned with each other precisely by means of bundle adjustment. Furthermore, all distortion arising during the creation of the image material is removed. This enables the correct depiction of the earth surface or surfaces.

Georeferenced orthomosaic photos
Orthomosaic photos are distortion-free and true-to-scale images of the earth’s surface. Georeferenced orthomosaic photos are a final product of an UAV surveying mission with a spatial reference through a coordinate system. The opportunities for using georeferenced orthomosaic photos are highly diverse and range from surveying, cartography, use in GIS software (geographic information systems), use in rural and urban planning, right through to visualisation. Orthomosaic photos are produced in accordance with the purpose of use to various scales and resolutions.
Volume calculation and quantity surveying
With our drones, we are able to record large spaces such as stockpiles, landfills, quarries and construction zones three-dimensionally in an efficient, contact-free and high-precision manner in order to be able to survey them. We produce a 3D point cloud out of the images captured during a flight (photogrammetry) or laser scanning data, on the basis of which we perform an exact volume and quantity calculation of actual conditions. By doing two flights at different times we can document an exact delta (difference comparison) of quantity changes. Target/actual comparisons also pose no problem at all. Furthermore, volume calculation and quantity surveying deliver orthomosaic photos if it is necessary for orientation or for defining materials and/or storage spaces.
Digital terrain models
Digital terrain model is a generic term for various types of digital elevation models (DEMs), such as the digital terrain model. The digital terrain model (DTM) is selected when elevation structure is of key importance and only the natural earth surface is required. Elements which are not required or desired, such as vegetation and various objects, are not included or depicted in the model. A digital surface model, or DSM for short, refers to an exact depiction of actual conditions in which not only the surface but also elements located there, such as vegetation and buildings, are depicted. Digital terrain models generally portray very realistic and true-to-scale illustrations of landscapes, surfaces and objects and offer a wide range of application options.
Ground sampling distance (gsd) – ground pixel resolution
The measure – referred to as both ground sampling distance and ground pixel resolution – provides information on the level of resolution of an image point (pixel) on the ground illustrated (earth’s surface). If we take a GSD of 1 cm, by way of example, this means one pixel in an image, say of an orthomosaic photo, represents one centimetre of the surface. We can use the GSD to determine the resolution, level of detail and thus the quality of an aerial photograph. The smaller the value of the GSD, the more detailed and more precise the depiction – this, in turn, means a larger amount of data.
Use of UAV data in geographic information systems
Geographic information systems (GIS) refers to information systems which are used for recording, managing and processing spatial data. Correct data of the optimum size and resolution is decisive for efficient use of geodata in GIS software and GIS systems. In addition to hardware and software, a wide variety of data subject to strict quality requirements is above all required for GIS applications, which we generate and supply using our UAVs. With GIS data records, discussing all data formats and quality requirements beforehand in order to be able to work systematically and efficiently is of crucial importance.
UAV surveying and mapping in detail explained
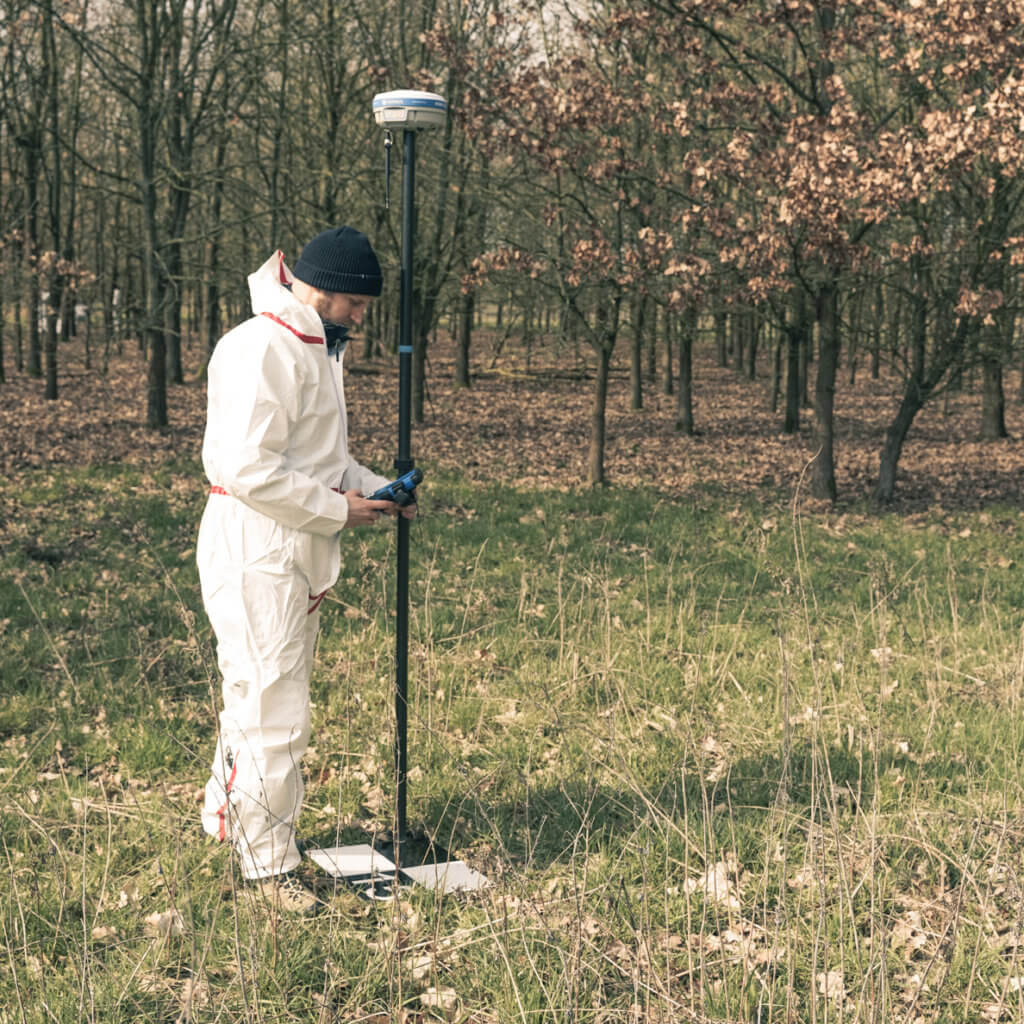
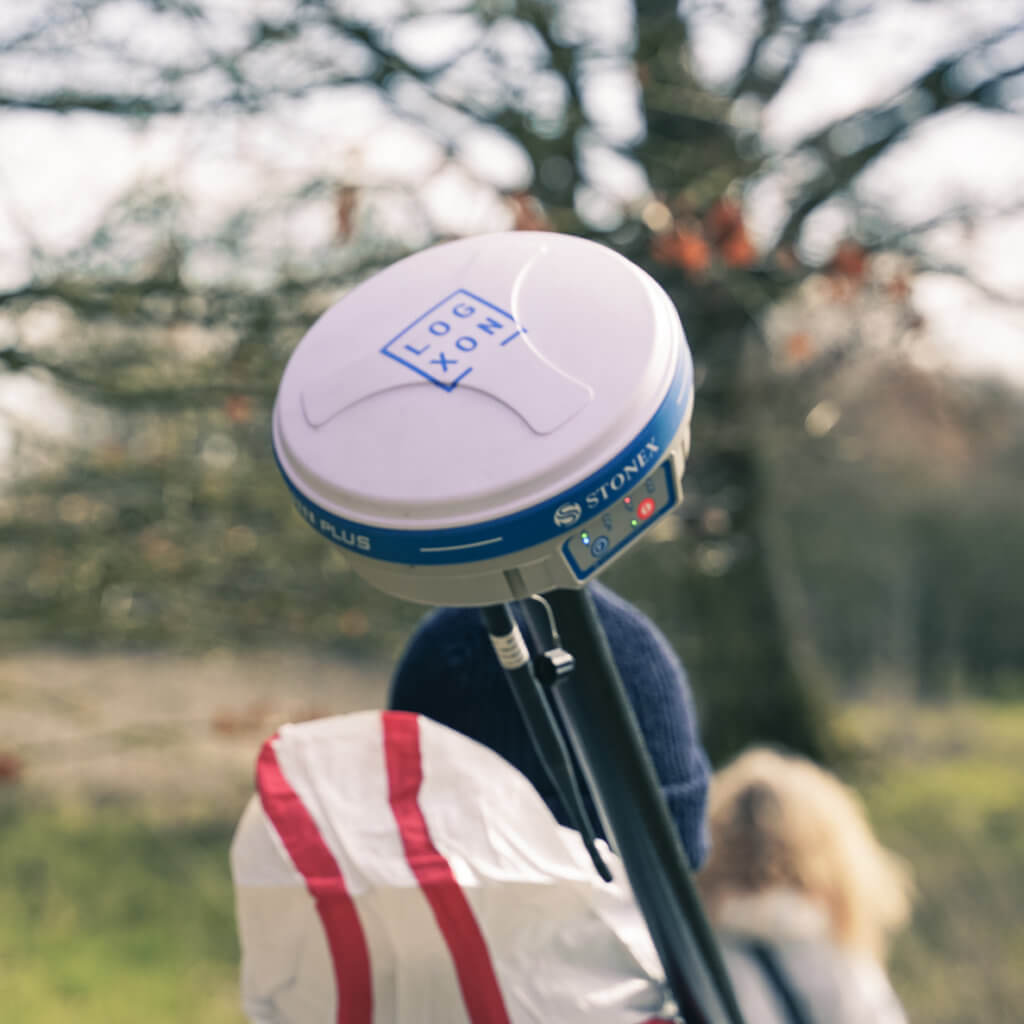
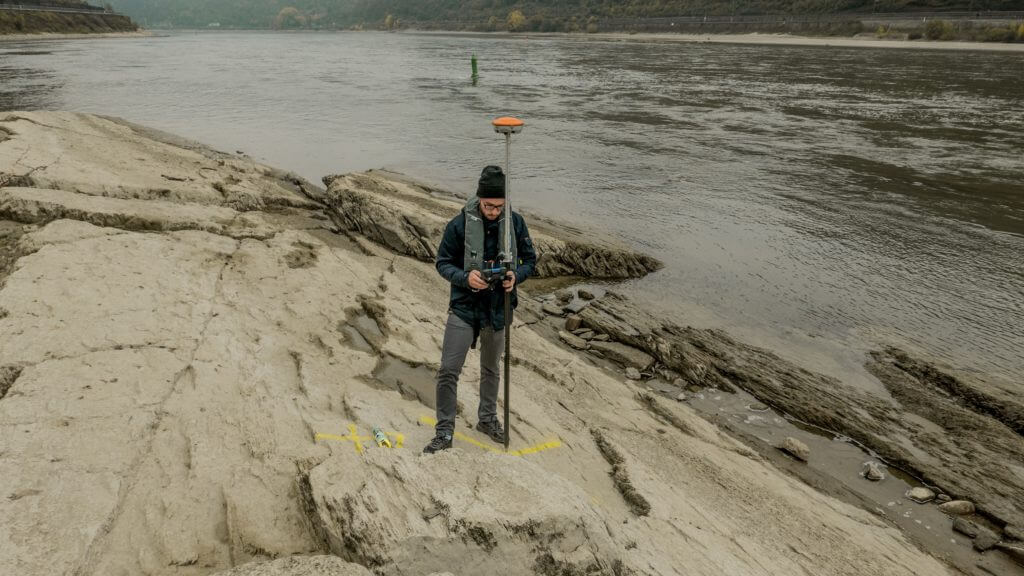
The precise recording of large areas or complex projects with classical surveying methods, such as the tachymeter or GNSS, requires larger point quantities and thus a lot of time expenditure, and workers are often exposed to dangers. With our UAVs, we are able to perform efficient, contact-less and high-precision condition recordings (positional and elevation recordings) in the sub-centimetre range. Even surveying difficult-to-access objects – such as tall façades, bridges, landfills, pits, stockpiles, quarries and open-pit mining zones –
with centimetre-precision poses no problem. By using our surveying drones, time and cost investments can be dramatically reduced for the measurement of many projects. In addition, measurements can be repeated as often as you like for documentation purposes. From the images or laser scanning data taken during flights (photogrammetry), we process a 3D point cloud, on the basis of which we produce high-precision data records, such as georeferenced orthomosaic photos and digital terrain models (DSMs / DTMs / height grids). By means of GIS (Geographic Information System) or CAD software, topographic maps, site plans and as-built plans can efficiently be created out of this material. In addition to GIS/CAD applications, the data records can also be output in the required format for use in BIM software (Building Information Modelling). We supply the data records in all common GIS, CAD, BIM or 3D formats.
Volume calculation and quantity surveying explained in detail
With the help of drones / UAVs, the volume calculation, quantity surveying and three-dimensional mapping of stockpiles, gravel pits, landfills or quarries is no longer an expensive undertaking nowadays. With UAV surveying methods we can offer enormous cost savings in comparison to conventional, complex measuring methods. The drones capture the data using cameras (photogrammetry) or LiDAR scanners (laser scanning). In a very short time and to minimal cost, high-precision 3D surveying can be achieved, based on which exact volume calculations and quantity surveying can be performed and documented. The process is contact-free, and thus safe for your workers and ours, because nobody has to enter hazard zones. What is more, UAV flights can take place during operations, meaning you are not obstructed in your day-to-day business.
For stockpiles or the three-dimensional surveying of landfills and quarries, we can determine the actual condition on day X for documentation on the one hand, on the other we can document an exact delta (difference comparison) of the change in quantity by means of two flights at different times. Regular target/actual comparisons for monitoring, for follow-up calculations and for determining forecasted billing quantities no longer represent a problem. From the derived data, a DTM can also be generated, which can then be compared with the last DTM.
Using UAVs, moved quantities, depleted raw materials, bulk material, piles of rubble, excavated material and subsidence can thus be determined efficiently and economically. Furthermore, the data can be used for accounting for stock levels and for inventory management. You have the option of obtaining the following data records as a result: 3D point clouds, orthomosaic photos, DTMs or complete numerical documentation of the volume or delta (volume changes).
Overview of services for volume calculation and quantity surveying in detail:
- Regular documentation of landfills and stockpiles.
- Inventories and accounting for stock levels (value determination).
- Difference comparison of quantity changes (delta calculation)
- Target/actual comparisons for monitoring and consumption calculations.
- Determining and updating forecasted billing quantities
- Calculating filling volumes
- Volume calculation and documentation of closures and land renaturation (e.g. waste disposal sites).
- Monitoring slope movements
- Cubature calculations
- Project progress measurements
- Documentation of material and object subsidence/sinking.